Dashboard
Trends Dashboard Guide
Overview
The Trends Dashboard is your command center for exploring and analyzing trends in Sila TrueTrends. It provides comprehensive visualizations, metrics, and insights about trending topics across various categories and time periods.
Accessing the Dashboard
Navigation
- Click "Trends" in the sidebar
- Or navigate from chat suggestions
- Direct URL: [YourDomain]/trends
- Access from search results
Dashboard Layout
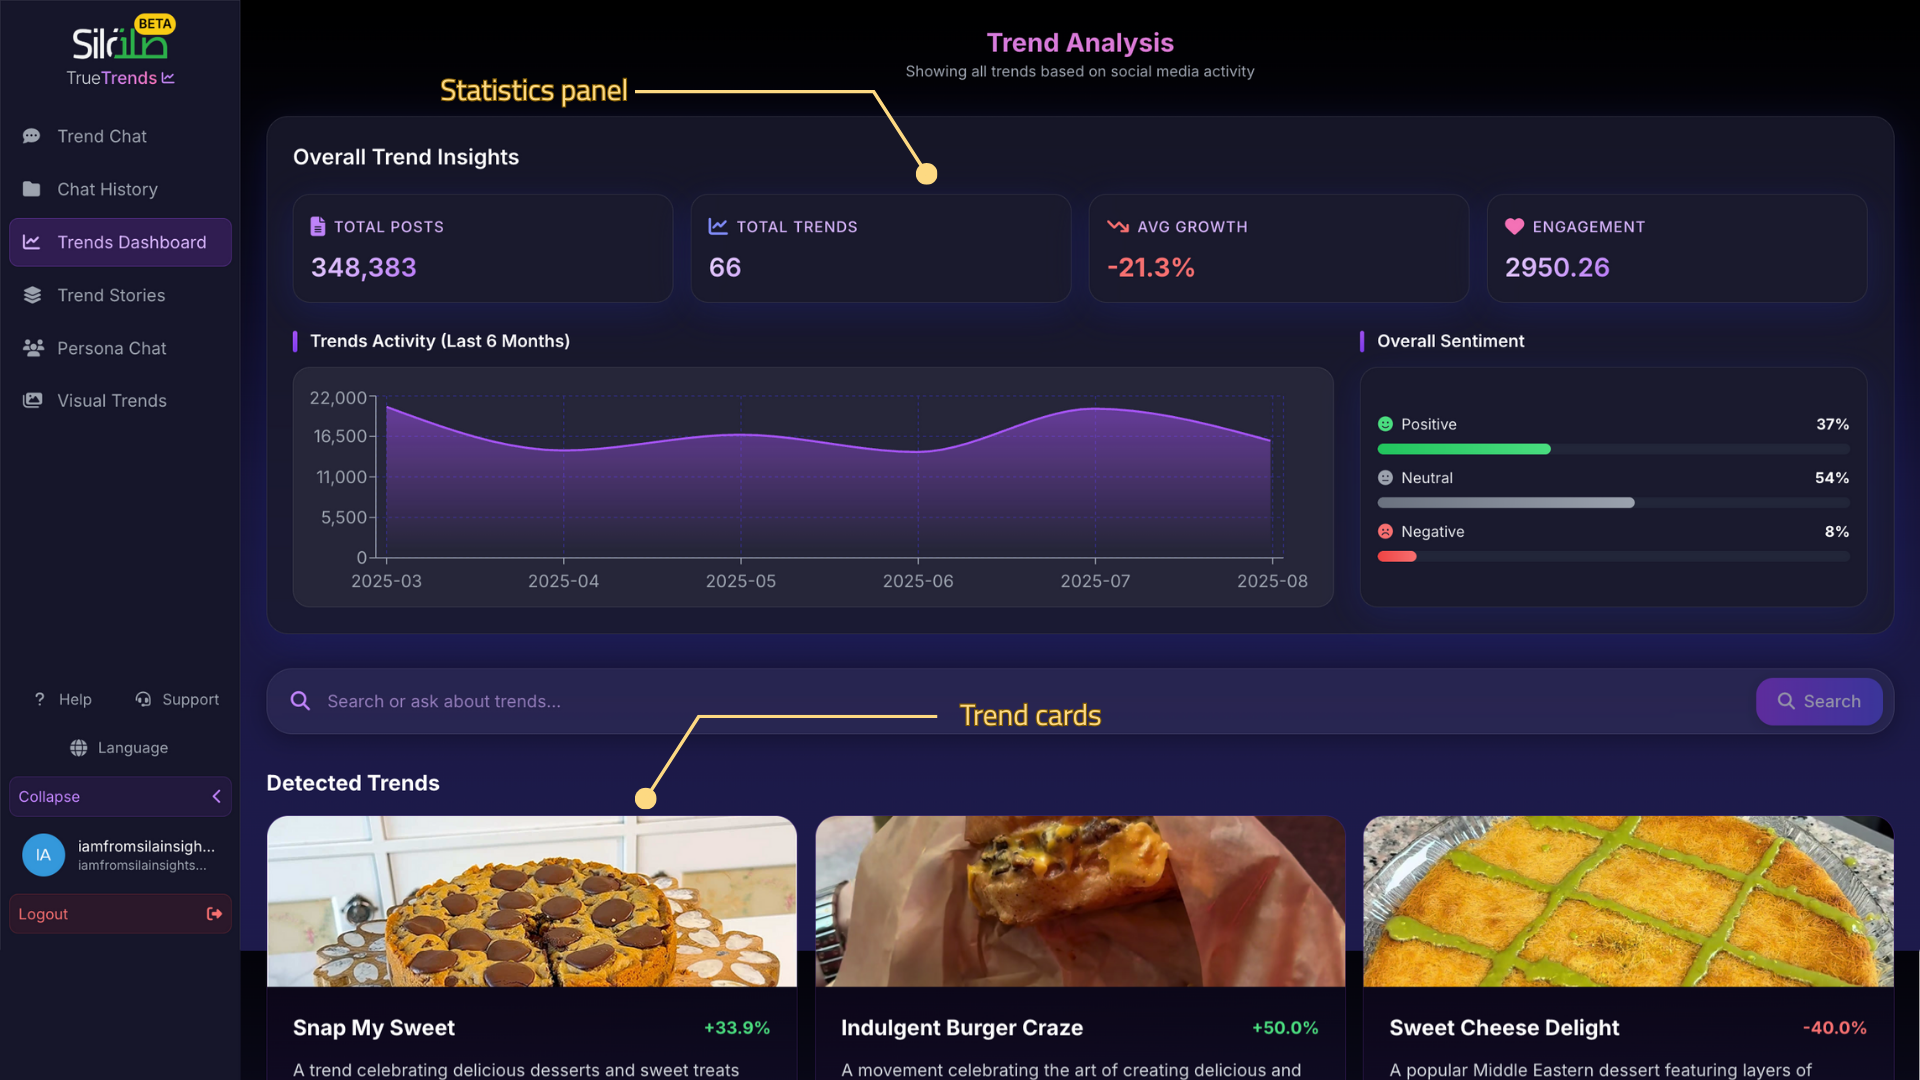 Full dashboard view showing statistics panel, filters, trend cards, and navigation elements
- Header Section: Overall statistics
- Filter Controls: Top navigation
- Trend Cards Grid: Main content area
- Sidebar: Additional filters (if expanded)
- Footer: Pagination and view options
Dashboard Components
Overall Statistics Panel
Key Metrics Displayed
- Total Posts: Volume of social mentions
- Active Trends: Number of trending topics
- Growth Rate: Overall trend acceleration
- Engagement Rate: Average interaction level
- Sentiment Score: Overall positivity
- Time Period: Data range shown
Understanding Metrics
- Posts: Raw volume indicator
- Trends: Unique topic count
- Growth: Week-over-week change
- Engagement: Likes, shares, comments
- Sentiment: -100 to +100 scale
Trend Cards
Card Information
Each trend card displays:
- Trend Name: Primary topic title
- Growth Indicator: ↑↓ with percentage
- Engagement Score: Social interaction level
- Sentiment Badge: Positive/Neutral/Negative
- Category Tag: Primary classification
- Preview Text: Brief description
- Visual Preview: Image if available
- Time Indicator: How recent
Card Interactions
- Click: Open detailed view
- Hover: Show expanded preview
- Star: Save to favorites
- Share: Get shareable link
- Compare: Select for comparison
Card Visual Indicators
- Border Color: Sentiment (green/gray/red)
- Growth Arrow: Direction and intensity
- Engagement Bar: Relative popularity
- New Badge: Recently emerged
- Hot Badge: Rapidly growing
Understanding Trend Data
Growth Metrics
Growth Rate Calculation
- Based on mention volume
- Compared to previous period
- Adjusted for seasonality
- Weighted by influence
Growth Indicators
- Explosive (>100% growth)
- Strong (50-100% growth)
- ↗ Moderate (10-50% growth)
- → Stable (-10% to +10%)
- ↘ Declining (-10% to -50%)
- Falling (>50% decline)
Engagement Analysis
Engagement Components
- Likes/Reactions: Positive signals
- Comments: Discussion level
- Shares: Viral potential
- Mentions: Conversation volume
- Influence: Author authority
Engagement Levels
- Viral: Exceptional engagement
- High: Above average
- Medium: Typical levels
- Low: Below average
- Emerging: Just starting
Sentiment Analysis
Sentiment Categories
- Positive: Favorable reception
- Neutral: Factual/Balanced
- Negative: Critical/Concerns
- Mixed: Varied opinions
Emotion Breakdown
Common emotions detected:
- Joy/Excitement
- Trust/Confidence
- Anticipation
- Surprise
- Concern/Fear
Interactive Features
Trend Comparison
How to Compare
- Select first trend (checkbox)
- Select additional trends
- Click "Compare" button
- View side-by-side analysis
Comparison Metrics
- Growth rates
- Engagement levels
- Sentiment scores
- Demographics
- Geographic distribution
Quick Actions
From Dashboard
- Filter by Category: Click tag
- Search Similar: Find related
- Generate Story: Create report
- Export Data: Download CSV
- Share Insights: Send link
Hover Interactions
Card Hover Effects
- Expanded preview
- Additional metrics
- Quick action buttons
- Related trends
- Social proof
Time Series Visualization
Understanding the Chart
Chart Elements
- X-axis: Time period
- Y-axis: Mention volume
- Line: Trend trajectory
- Area: Volume indication
- Dots: Data points
Chart Interactions
- Hover for exact values
- Click and drag to zoom
- Double-click to reset
- Toggle trends on/off
- Export chart image
Historical Patterns
Pattern Recognition
- Steady Growth: Consistent upward
- Hockey Stick: Sudden spike
- Seasonal: Cyclical patterns
- Plateau: Growth leveling
- Volatile: Unpredictable
Dashboard Customization
Personalizing Your View
Save Dashboard Settings
- Configure filters
- Set sort preferences
- Choose view mode
- Click "Save View"
- Name your configuration
Quick Access
- Access saved views
- Set default view
- Share view with team
- Export configuration
Dashboard Widgets
Available Widgets
- Statistics summary
- Category breakdown
- Geographic heatmap
- Demographic charts
- Sentiment gauge
Widget Management
- Add/remove widgets
- Resize widgets
- Rearrange layout
- Save layout
Using Dashboard Data
For Research
Research Workflow
- Set appropriate filters
- Review overall statistics
- Identify top trends
- Compare related trends
- Deep dive into specifics
- Export findings
For Monitoring
Monitoring Setup
- Save specific filters
- Set time range
- Bookmark dashboard
- Check regularly
- Note changes
For Reporting
Report Generation
- Configure dashboard
- Screenshot or export
- Download raw data
- Create visualizations
- Share insights
Performance Tips
Loading Optimization
- Use specific filters
- Limit items per page
- Close unused widgets
- Clear cache regularly
- Use saved views
Navigation Efficiency
- Keyboard shortcuts
- Quick filters
- Saved searches
- Bookmarks
- Recent history
Mobile Dashboard
Mobile Optimizations
- Responsive card layout
- Touch-friendly controls
- Swipe navigation
- Simplified filters
- Essential metrics only
Mobile Features
- Pull to refresh
- Swipe between cards
- Tap for details
- Pinch to zoom charts
- Share via mobile apps
Troubleshooting
Dashboard Not Loading
- Check internet connection
- Clear browser cache
- Disable extensions
- Try different browser
- Contact support
Missing Data
- Check filter settings
- Verify time range
- Ensure logged in
- Check permissions
- Refresh page
Slow Performance
- Reduce items displayed
- Simplify filters
- Close other tabs
- Update browser
- Check connection speed
Best Practices
Daily Use
Check key metrics first Note significant changes Investigate anomalies Save important trends Export daily summary
Weekly Review
Compare to previous week Identify emerging trends Review saved trends Update monitoring list Share team insights
Monthly Analysis
Full dashboard review Trend progression analysis Category comparisons Generate reports Plan next actions