Visual Overview
Visual Trends Overview
What Are Visual Trends?
Visual Trends in Sila TrueTrends analyzes image-based content from social media to identify patterns, styles, and emerging visual preferences. This feature uses AI to understand what's visually appealing and trending across different categories.
Why Visual Analysis Matters
The Power of Visual Data
- Consumer Behavior: 90% of information transmitted to brain is visual
- Purchase Decisions: Visual appearance influences 93% of buying decisions
- Engagement: Visual content gets 94% more views than text
- Trend Signals: Visual trends often precede verbal/written trends
- Cultural Insights: Visual preferences reveal cultural shifts
Use Cases
- Product design inspiration
- Packaging design trends
- Color palette preferences
- Styling and presentation
- Visual marketing strategies
- Aesthetic evolution tracking
Accessing Visual Trends
Navigation
- Click "Visual" in sidebar navigation
- Or navigate from trend details
- Direct URL: [YourDomain]/visual
- Access from search results with visual data
Interface Layout
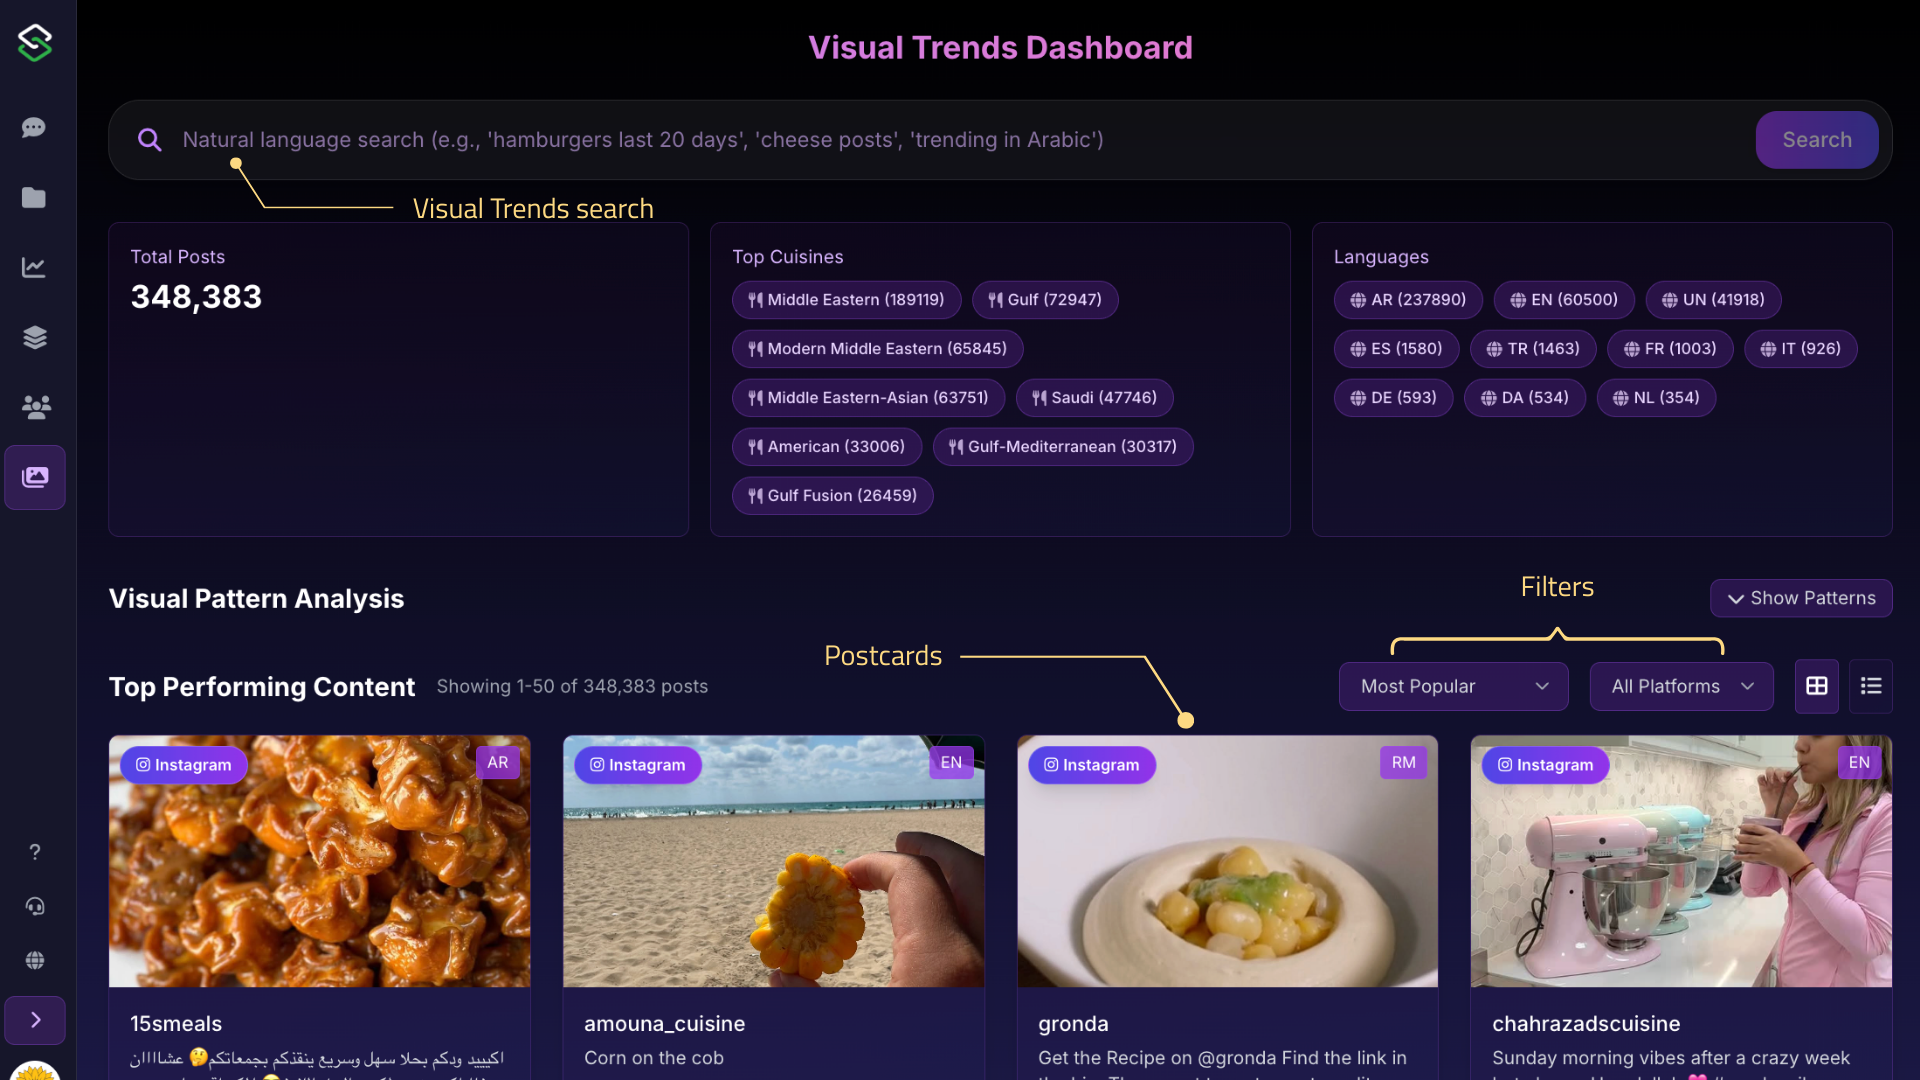 Full visual trends interface showing image grid, filters, and analysis panels
- Visual Dashboard: Grid of trending images
- Pattern Categories: Visual theme groups
- Filter Panel: Refine visual results
- Analysis Panel: Insights about visuals
- Trend Timeline: Visual evolution over time
Understanding Visual Data
Types of Visual Trends
Product Presentation
- Product photography angles
- UI/UX design layouts
- Fashion styling techniques
- Tech product showcases
- Architectural presentations
Color Trends
- Dominant color palettes
- Color combinations
- Seasonal color shifts
- Brand color evolution
- Mood-based colors
Style Patterns
- Minimalist vs maximalist
- Rustic vs modern
- Natural vs processed
- Traditional vs innovative
- Cultural style influences
Composition Trends
- Layout patterns
- Typography usage
- Graphic elements
- White space usage
- Visual hierarchy
Visual Metrics
Engagement Indicators
- View Count: How many saw it
- Share Rate: Visual virality
- Save Rate: Bookmark frequency
- Interaction Time: Viewing duration
- Click-through: Action taken
Pattern Strength
- Frequency: How often appears
- Growth Rate: Increasing presence
- Geographic Spread: Regional adoption
- Cross-platform: Multiple channels
- Consistency: Pattern stability
Visual Dashboard Features
Main Grid View
Image Cards
Each card displays:
- Thumbnail image
- Trend category
- Engagement score
- Growth indicator
- Source platform
- Time posted
Card Interactions
- Click: Enlarge image
- Hover: Quick stats
- Analyze: Deep dive
- Similar: Find related
Pattern Recognition Panel
Identified Patterns
System detects:
- Color schemes
- Composition styles
- Object arrangements
- Text overlays
- Filter effects
- Lighting styles
Pattern Categories
- Aesthetic: Overall visual style
- Functional: Practical presentation
- Cultural: Regional influences
- Seasonal: Time-based patterns
- Emotional: Mood conveyed
Timeline Visualization
Visual Evolution
Track how visuals change:
- Style progression
- Color shift over time
- Composition evolution
- Trend lifecycle stages
- Emergence patterns
Comparison View
- Before/after trends
- Regional differences
- Platform variations
- Demographic preferences
- Category comparisons
Analyzing Visual Trends
Visual Intelligence
What the AI Analyzes
- Objects: Items in images
- Colors: Palette and mood
- Composition: Layout and balance
- Style: Aesthetic choices
- Context: Setting and usage
- Emotion: Feeling conveyed
Insights Generated
- Emerging visual patterns
- Style predictions
- Color forecasts
- Design recommendations
- Cultural influences
Pattern Categories
Products & Services Visuals
- Plating trends
- Photography styles
- Color palettes
- Garnish patterns
- Vessel choices
Packaging Design
- Label aesthetics
- Color schemes
- Typography trends
- Material visibility
- Sustainability cues
Lifestyle Imagery
- Usage contexts
- Social settings
- Demographic representation
- Activity associations
- Aspirational elements
Using Visual Insights
For Product Development
Design Inspiration
- Identify popular aesthetics
- Understand color preferences
- See presentation styles
- Note packaging trends
- Track style evolution
Market Validation
- Test visual concepts
- Compare to trends
- Identify gaps
- Validate choices
- Predict reception
For Marketing
Content Creation
- Understand visual language
- Match trend aesthetics
- Choose color palettes
- Style photography
- Design graphics
trend analysis
- Visual storytelling
- Platform optimization
- Demographic targeting
- Seasonal themes
- Trend alignment
For Innovation
Opportunity Identification
- Spot visual gaps
- Emerging aesthetics
- Untapped styles
- Cultural shifts
- Future directions
Visual Search Features
Search by Visual Attributes
Color Search
- Select color palette
- Find matching trends
- See color evolution
- Compare combinations
Style Search
- Choose aesthetic
- Find similar styles
- Track style trends
- Compare approaches
Category Search
- Product type visuals
- Usage contexts
- Demographics
- Regions
Upload Comparison
- Upload your image
- Find similar trends
- Compare aesthetics
- Get recommendations
- Identify gaps
Filters and Refinement
Visual-Specific Filters
Style Filters
- Minimalist/Maximalist
- Modern/Traditional
- Natural/Processed
- Premium/Accessible
- Professional/User-generated
Color Filters
- Warm/Cool tones
- Bright/Muted
- Monochrome/Colorful
- Specific color ranges
Time Filters
- Trending now
- Emerging visuals
- Seasonal patterns
- Historical comparison
Platform Filters
- TikTok
- Platform-specific
Best Practices
Do's
Analyze multiple examples Consider cultural context Track evolution over time Compare across platforms Save inspiring visuals
Don'ts
Copy directly without adaptation Ignore regional differences Miss underlying patterns Focus on single examples Neglect context
Visual Analysis Tips
- Look for patterns not individual images
- Consider context of visual usage
- Track consistency across platforms
- Note variations by demographic
- Monitor evolution over time
Combining with Other Features
Visual + Chat
- Ask about visual trends
- Get interpretation help
- Understand implications
- Request predictions
Visual + Personas
- Get expert visual analysis
- Regional visual preferences
- Consumer psychology of visuals
- Market implications
Visual + Search
- Find specific visual styles
- Search by attributes
- Combine text and visual
- Refine with filters
Mobile Experience
Mobile Optimization
- Touch-friendly grid
- Swipe navigation
- Pinch to zoom
- Quick save options
- Simplified filters
Mobile Features
- Image recognition
- Camera integration
- Quick capture
- Visual notes
- Share to apps
Troubleshooting
Images Not Loading
- Check internet connection
- Clear browser cache
- Disable ad blockers
- Try different browser
- Check filter settings
Poor Quality Results
- Adjust filters
- Broaden search terms
- Check time range
- Try different categories
- Lower relevance threshold